**Bitcoin Price Trends: Analyzing the Current Downtrend and Historical Correlation**
After reaching an all-time high of over $100,000, Bitcoin’s price has entered a multi-week downtrend, prompting questions about its alignment with the 2017 bull cycle. This analysis will explore the data to determine how Bitcoin’s current price movements compare to previous bull markets and what may lie ahead for BTC.
### Current Price Action vs. Historical Patterns
Bitcoin’s price trajectory since the lows of the 2022 bear market has shown notable similarities to the 2015–2017 cycle, which peaked at $20,000 in December 2017. However, the recent downtrend represents the first significant divergence from the 2017 pattern. If Bitcoin were still following the 2017 cycle, it would have been rallying to new all-time highs over the past month. Instead, Bitcoin has experienced sideways movement and declines, indicating a potential weakening correlation.
### Correlation with the 2017 Cycle
Despite the recent divergence, the historical correlation between Bitcoin’s current cycle and the 2017 cycle remains impressively high. Earlier this year, the correlation was approximately 92%, which has slightly decreased to 91% due to the recent price divergence. This figure is still remarkably high for financial markets.
### Understanding the MVRV Ratio
The MVRV Ratio is a crucial indicator of investor behavior, measuring the relationship between Bitcoin’s current market price and the average cost basis of all BTC held on the network. A sharp rise in the MVRV ratio indicates that investors are sitting on significant unrealized profits, often preceding market tops. Conversely, a decline toward the realized price suggests Bitcoin is trading near the average acquisition price, typically marking a bottoming phase.
– The recent decline in the MVRV ratio reflects Bitcoin’s correction from its all-time highs.
– The MVRV ratio remains structurally similar to the 2017 cycle, showing an early bull market rally followed by multiple sharp corrections, maintaining an 80% correlation.
### The Impact of Data Lag
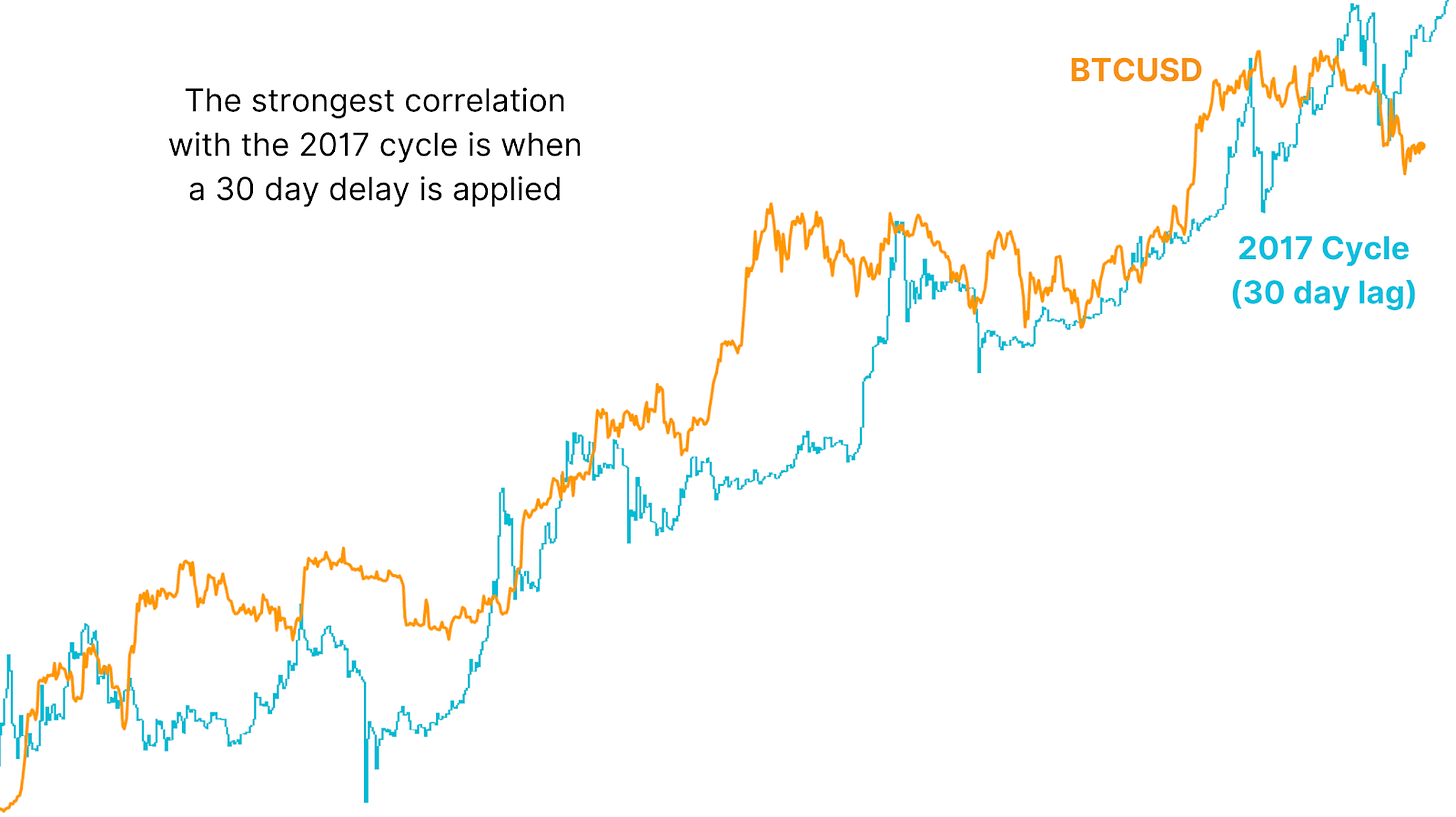
One possible reason for the recent divergence is the influence of data lag. Bitcoin’s price action has shown a strong correlation with Global Liquidity, which is the total money supply in major economies. Historical analysis indicates that changes in liquidity often take about two months to manifest in Bitcoin’s price action.
By applying a 30-day lag to Bitcoin’s price action relative to the 2017 cycle, the correlation increases to 93%, marking the highest recorded correlation between the two cycles. This lag-adjusted pattern suggests that Bitcoin may soon resume the trajectory seen in 2017, indicating a potential major rally ahead.
### Conclusion
As Bitcoin navigates its current downtrend, the historical correlations and indicators suggest that it may still align with previous bull cycles. Will Bitcoin’s price action soon reflect a return to its 2017 trajectory?
### FAQs:
**Q: What is the MVRV Ratio and why is it important?**
A: The MVRV Ratio measures the relationship between Bitcoin’s current market price and the average cost basis of all BTC held on the network. It helps indicate investor behavior and potential market tops or bottoms.